|
You heard it here...
Dear
Editors and Translators:
Here is a market chart of the American stock-market that Glenn,
a good friend of mine drew up over 13 years ago.
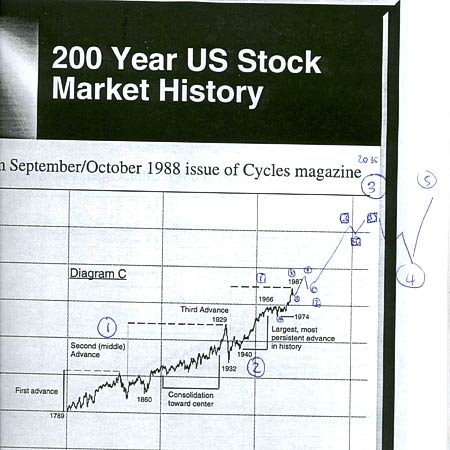
It
is base on Elliot Wave Theory. This fractal geometry is now
being used a lot to describe market psychology. Glenn is the
number one expert in the world on Elliot Wave Theory. Glenn
and I have been friends for over 13 years. All market behavior
has the same wave structure on the century, decade, yearly,
monthly, week,daily, and minute level. The same basic patterns
repeat over and over again in infinite combinations on all these
time-frames.
But
the basc pattern is the same. 1-2-3-4-5 for implulse waves up
or down and A-B-C for corrective waves up or down. That's it.
Since the American Revolution up to the American great depression
in the 1930's the big waves 1 and 2 have been working themselves
through. Wave 2 is corrective like wave 4. They are waves that
stall and waste time. Waves 1, 3, and 5 are impulse waves They
move fast and make progress. Well the big century wave 3 began
in 1949 after WWII. It's smaller wave 1 fueled the boom of 1949-1966.
Then a corrective wave 2 began. Glenn thought it ended in 1994,
but it's ending now. Yes, it was an extended wave 2 going upward.
It was a running correction and it stalled and wasted less time
because of enormous underlying market strength. This wave 2
will be through in 5-13 years and then wave 3 of 3 will begin.
The biggest global boom in history will start. The Dow will
go to 100,000 by 2030.
But between now and 2010. There will be great turbulence. Governments
and nations will be swept away like leaves in a tornadoe. The
big warning shot is fired towards the end of Two Short Stories
in Challenge and Glory. This is why the author has decided to
release all his writings for simultaneous publication and translation
in America and abroad. The time has arrived now to throw a compass
out into the world.
Michael
|